
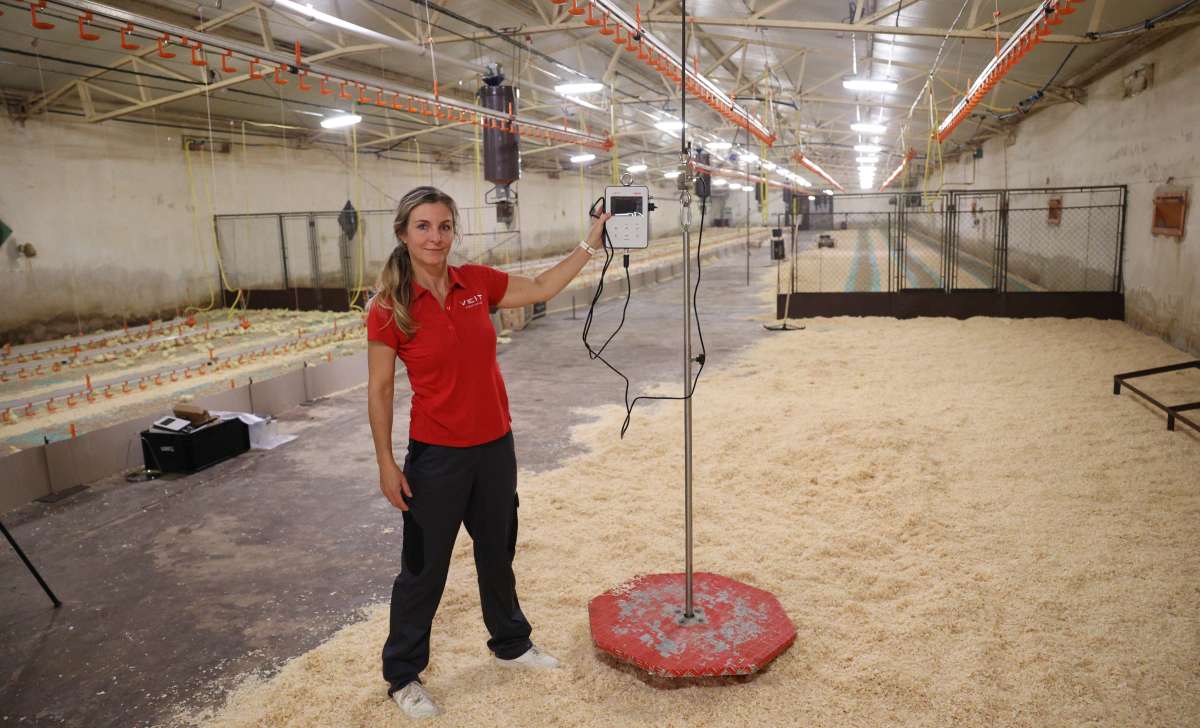
Accurate live weight data is the control that connects on-farm growth to carcass yield and to the way a plant grades the flock. Weighing does not raise yield by itself, because genetics, slaughter age and handling set most of it. It shows when a flock reaches its target weight and how widely the birds vary, so managers can correct problems and check equipment early. In commercial broiler flocks the coefficient of variation (CV) of body weight usually runs from 10 to 15% at market age (Choi et al., 2026). The routine is to weigh representative samples through the cycle, follow CV alongside the average, and set the processing date from measured weights rather than estimates. That decides how many birds land inside the weight range the plant wants.
What the plant looks at when it grades your birds
A poultry processing plant does not buy a flock average. It buys carcasses that fit a line. Grading of poultry carcasses sorts them by weight class and by visible quality. Hubbard’s technical team says a plant needs flocks with the right average weight and little deviation from the farm’s sample weights, and calls the share of carcasses inside the desired weight range a very important measure. A wrong forecast of average weight costs money in any flock. In sexed flocks the weight range is narrower, which makes such errors especially costly in commercial and logistical terms. In as-hatched flocks, the plant’s own growth curves tend to skew towards the light side, so most carcasses weigh less than the flock average (Hubbard, n.d.).
Not all downgraded carcasses trace back to weight. Cobb lists bruised legs, broken wings and scratches from catching as causes of downgrades and lost yield (Cobb-Vantress, 2021), and no scale prevents those. Weight data covers the other side: whether birds arrive at the right size and in a narrow spread.
How slaughter age and weight shift the yield of the carcass
Yield rises as birds get heavier. Aviagen’s Ross 308 performance objectives show this for male birds, where the dressing percentage, listed as eviscerated yield (the carcass without neck, abdominal fat and organs, as a share of live weight), rises from 69.79% at 1.6 kg to 72.38% at 2.4 kg and 73.42% at 3.0 kg (Aviagen, 2022).
| Live weight (males) | Eviscerated yield, % of live weight | Breast meat yield, % of live weight |
| 1.6 kg | 69.79% | 21.54% |
| 2.4 kg | 72.38% | 24.63% |
| 3.0 kg | 73.42% | 25.86% |
Breast meat yield rises faster still, from 21.54% of live weight at 1.6 kg to 24.63% at 2.4 kg and 25.86% at 3.0 kg. In both columns the gain is steepest at the light end: eviscerated yield adds 2.6 points between 1.6 and 2.4 kg, against 1.0 point between 2.4 and 3.0 kg. These are performance objectives, not trial results, and they are dry yields, which leave out water retained in chilling. Aviagen notes that carcass yield as a share of live weight can differ by more than 2% depending on abdominal fat, chilling method, cutting technique and feed withdrawal, so a plant’s own figures will not match the table exactly (Aviagen, 2022).
Two points follow. The weight at slaughter is a yield decision as well as a scheduling one, and it needs measured weights behind it. Choi et al. (2026) also argue that uniformity should weigh in when choosing slaughter age, since how it moves with age depends on management, health and environment.
Later is not always better. In the same Ross 308 tables, male daily gain levels off at 112 g from about day 38 to day 43 and then falls, while daily feed intake keeps rising, from 195 g at day 35 to 236 g at day 45. Cumulative feed conversion worsens from 1.390 to 1.571 over those ten days. Feed eaten per gram gained rises from 1.8 g to 2.1 g (by simple calculation from the daily figures). Once gain levels off, extra days add weight at a rising feed cost, so the slaughter age comes from the growth curve and the plant’s demand, not from the highest possible yield (Aviagen, 2022).
Why weight uniformity decides how many birds fit the band
The uniformity of broiler weights is easy to lose and slow to recover. Choi et al. (2026) report that flocks typically reach about 90% uniformity between days 14 and 49. In the trials they tabulate, heat stress lowered uniformity by 3.6 to 4.8 percentage points, and a low-energy, low-protein diet lowered it by 15.1 points. Even among 45 Ross 308 flocks on similar management in Norway, CV ranged from 11 to 18% at about 30 days. The more uneven flocks grew more slowly, converted feed less well and lost more birds, which the authors read as a sign of an underlying health or management problem. Those flocks also had fewer birds rejected at slaughter, because the causes of poor growth and mortality are not necessarily rejection causes (Vasdal et al., 2019).
Few cheap fixes exist once the spread has opened, and culling the lightest birds is the most common one (Choi et al., 2026). Early warning is worth more than a late correction. The BAT2 Connect automatic poultry scale records weights around the clock without an operator and reports average weight, daily gain, CV, uniformity and a growth curve, plus the gap to the standard growth curve. It gives a flock-level picture, so a widening CV shows up while there is still time to check ventilation and feed quality.
Sampling is where accuracy is won or lost. Cobb divides the house into three sections, weighs a random sample of about 100 birds in each (or 1% of the flock), includes every bird in the catch pen except culls, and counts those within 10% of the sample average. Cobb also lists carcass yield evaluations after processing as a way to judge uniformity, which closes the loop with the plant (Cobb-Vantress, 2021).
A flock-level CV can also hide structure. In mixed-sex flocks a single CV becomes less reliable with age, because two fairly uniform groups can together produce a CV that looks like poor uniformity (Hubbard, n.d.). The BAT1 manual poultry scale weighs birds by hand, marks sex with one touch and records a fleshing score in the same handling, so the sexes can be told apart in the data.
Protecting yield between the last weighing and the shackle
Weight on the farm is not the weight at the plant. Cobb recommends 8 to 12 hours of feed withdrawal, counted from the moment birds lose access to feed until shackling. Shorter withdrawal leaves feed and faeces in the gut, which causes yield and contamination problems. A longer starvation period before slaughtering weakens the intestines, so they tear during evisceration. Birds then keep shrinking by 0.25% of body weight an hour or more while they wait at the plant (Cobb-Vantress, 2021). On a 2.4 kg bird that is at least 6 g an hour, by simple calculation from that figure.
Cobb also asks farms to remove weighing scales and other equipment from the floor before the catching crew arrives (Cobb-Vantress, 2021), so the final weighing has to come earlier. A hands-on weighing session shortly before feed is withdrawn gives a measured average and spread, split by sex, to pass to the plant. Comparing that average with the plant’s receiving weights shows the shrink for that flock. This last step is a practical observation, not research-confirmed.
Between sessions, continuous flock-level weight records show whether daily gain still follows the plan, which matters when the processing date is fixed days ahead.
Turning weight records into a processing plan
A weight record helps only if it reaches the people who schedule the plant. BAT Cloud collects weight data from BAT1 and BAT2 Connect scales across farms and compares a flock with a previous or parallel flock and with Cobb, Aviagen or Hubbard growth charts. Access rights let a farm manager see one site while a supervisor sees all of them, and a manual sample weighing can refine the result. Before the plant is booked, the planner can check whether the flock is on its curve and whether CV has held steady.
Weight data cannot repair a bruised wing or a mistimed withdrawal. It does let a producer commit to a processing date, and tell the plant what to expect, on measured numbers.
References
- Aviagen. (2022). Ross 308/308 FF broiler: Performance objectives. https://aviagen.com/assets/Tech_Center/Ross_Broiler/RossxRoss308-BroilerPerformanceObjectives2022-EN.pdf
- Choi, J., Goo, D., Ko, H., Lee, J., & Kim, W. K. (2026). Factors affecting flock uniformity in broiler production: Individual, environmental, and management characteristics. Animals, 16(2), 185. https://www.mdpi.com/2076-2615/16/2/185
- Cobb-Vantress. (2021). Broiler management guide. https://www.cobb-vantress.com/resource/management-guides
- Hubbard Technical Team. (n.d.). Evaluating uniformity in broilers: Factors affecting variation (Technical bulletin). https://www.hubbardbreeders.com/media/9_tb_evaluating_uniformity_in_broilers_factors_affecting_variation_26102018.pdf
- Vasdal, G., Granquist, E. G., Skjerve, E., de Jong, I. C., Berg, C., Michel, V., & Moe, R. O. (2019). Associations between carcass weight uniformity and production measures on farm and at slaughter in commercial broiler flocks. Poultry Science, 98(10), 4261-4268. https://pmc.ncbi.nlm.nih.gov/articles/PMC6748757/